Vote Arlington 2: Populating the Data
Voting Data
To establish a voting participation rate, I am going to need to find the population in each precinct and the number of people from each precinct who voted. I will use the November 2010 general election since that year corresponds with the 2010 census data that I will use for average income.
I found the population of each precinct on the Virginia Government website at
Census 2010 Population Data (P.L. 94-171 Redistricting Data). I downloaded
the Precincts spreadsheet, and got a file named 2010_VTDs.xls. I opened
it in LibreOffice Calc and
removed all rows except for the 51 describing Arlington County precincts for
three sheets in the spreadsheet, and merged the results into a single sheet
and edited the column headers in preparation for saving as a CSV file.
For voter turnout I went to
apps.elections.virginia.gov/SBE_CSV/ELECTIONS/ELECTIONTURNOUT/ and
downloaded the file Turnout-2010 November General.csv. I used Calc to edit
this down to the 51 rows I need and then to merge it with the census population
spreadsheet into a single spreadsheet which I saved as a CSV file
named arl_nov_2010_voter_data.csv.
Income Data
Getting income data was more challenging than I had hoped. The granularity of the data is census block group, while my population data is at the census block level. As stated in the Wikipedia entry, the census block group is the “smallest geographical unit for which the bureau publishes sample data”. Sample data refers to data derived from a statistical sample. Income data, in this case, is sample data because it was not gathered from every household but instead from a statistical sample of households.
I found income data at the block group on the Census Bureau’s Developers website. JSON containing 2010 average income information for Arlington County is at:
The saved file is named acs5.json.
Metadata for this object can be obtained at
https://api.census.gov/data/2014/acs5/variables.json. Since this is a very
large file it will be helpful to put the relevant part of it here:
"B19301_001E": {
  "label": "Per capita income in the past 12 months
            (in 2014 Inflation-adjusted dollars)",
  "concept": "B19301. Per Capita Income in the Past 12 Months
              (in 2014 Inflation-Adjusted Dollars)",
  "predicateType": "int",
  "group": "N/A",
  "limit": 0,
  "validValues": [
  ]
},
The column headers of the data are:
"B19301_001E", "state", "county", "tract", "block group"
The immediate question now was whether voting precincts are composed of census block groups. To determine this I decided to use a spatial query to join census blocks into census block groups and then overlay these with the voting precincts.
Spatial Queries
On page 11-1 of Chapter 11: Census Blocks and Block Groups of the
Geographic Areas Reference Manual it states
that “[a block group] consists of all census blocks whose numbers begin with
the same digit in a given census tract.” I will use the two fields from the
raw_census_blocks table, tractce10 and blockce10, combining the
first field with the first digit of the second field to get a value that will
match tract + block group in the income data.
I am going to need to use a spatial query to determine which census blocks are in each voting precinct in my PostGIS spatial database.
Note
I used the Boundless: Introduction to PostGIS to review for this task, which proved a very helpful reference.
Note
The Boundless: Introduction to PostGIS uses pgAdmin, which I installed with following command:
$ sudo apt install pgadmin3
After launching it and selecting File -> Add Server.. on the menu bar,
I filled in the dialog box that appeared to connect to the database server
and connected to my database.
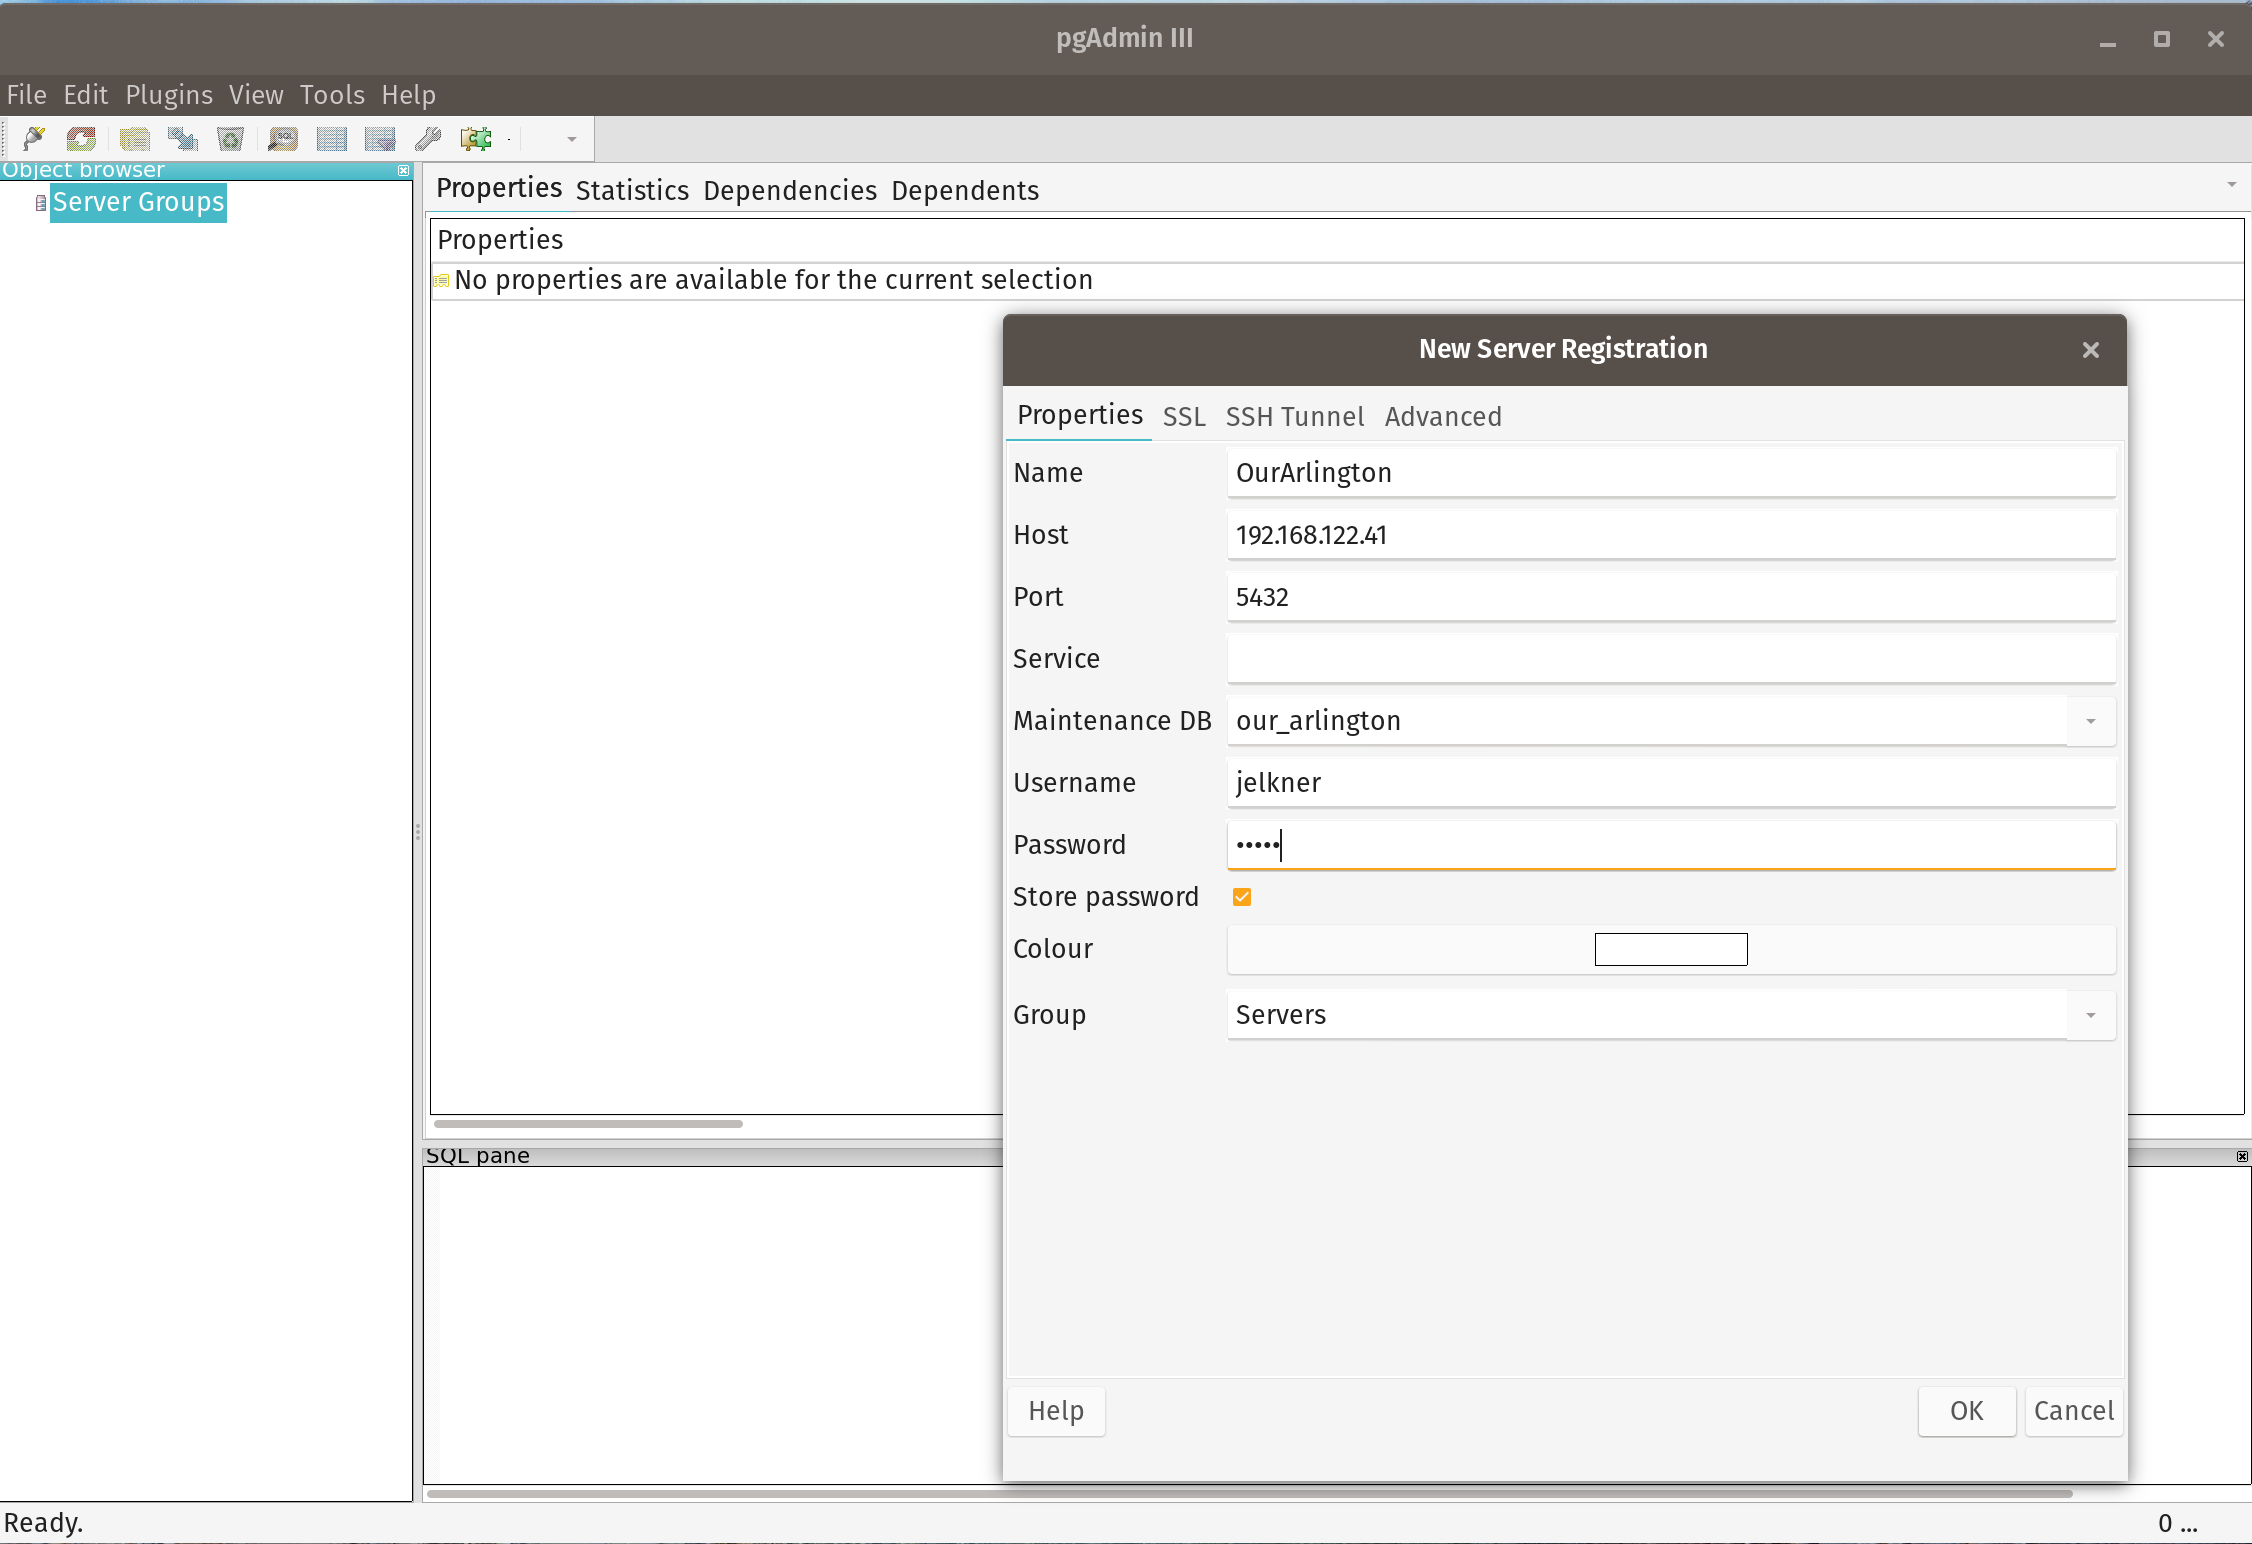
I’m an old timer more comfortable at the command-line, however, so I think I’ll stick to psql.
With help from Section 19: Geometry Constructing Functions
of the Boundless PostGIS workshop I put the following in a file named
create_block_groups_table.sql:
CREATE TABLE block_groups AS
SELECT
  tractce10 || substring(blockce10 from 1 for 1) AS block_group,
  ST_Union(geom) AS geom
FROM raw_census_blocks
GROUP BY block_group;
I then ran:
$ psql our_arlington < create_raw_block_groups_table.sql
and saw:
SELECT 181
meaning the 2188 census blocks make up 181 block groups. When I loaded the new
layer in QGIS, it was clear that, sadly, voting precincts are not composed of
census block groups. I dropped the block_group table since I won’t be
needing it, not with a geometry at least.
Income Data Revisited
To get my data to align, I will have to assume that per capita income within each census group is uniformly distributed throughout the group and can thus be assigned to each block within the group. I will then calculate per capita income per precinct using the census blocks that make up each precinct.
It now seems that I will need three tables to complete this investigation, a
census_blocks table that has total population, a block_groups table
with the per capita income, and a voting_precints table with voting age
population and voter turnout. I will use a combination of Python and SQL to set
all this up.
Setting Up the Tables
First I’ll create the tables:
CREATE TABLE census_blocks (
    gid integer,
    tract char(6),
    block char(4),
    total_pop integer NOT NULL DEFAULT 0,
    geom geometry(MultiPolygon,4269),
    PRIMARY KEY(gid)
);
CREATE TABLE voting_precincts (
    gid integer,
    precinct_num char(2),
    precinct_name text,
    vote_age_pop integer NOT NULL DEFAULT 0,
    voter_turnout integer NOT NULL DEFAULT 0,
    geom geometry(MultiPolygon,4269),
    PRIMARY KEY(gid)
);
CREATE TABLE block_groups (
    tract char(6),
    block_group char(1),
    income_percap integer NOT NULL DEFAULT 0,
    PRIMARY KEY(tract, block_group)
);
Viewing the tables after running this gives:
our_arlington=# \dt
                List of relations
 Schema |         Name         | Type  |  Owner
--------+----------------------+-------+---------
 public | block_groups         | table | jelkner
 public | census_blocks        | table | jelkner
 public | raw_census_blocks    | table | jelkner
 public | raw_voting_precincts | table | jelkner
 public | spatial_ref_sys      | table | jelkner
 public | voting_precincts     | table | jelkner
(6 rows)
Now I want to extract relevant information from the raw_census_blocks
table and insert it into the new census_blocks table, and from
raw_voting_precincts into voting_precincts:
INSERT INTO census_blocks (gid, tract, block, geom)
SELECT gid, tractce10, blockce10, geom
FROM raw_census_blocks;
INSERT INTO voting_precincts (gid, precinct_num, precinct_name, geom)
SELECT gid, substring(vtdst10 from 2 for 2), name10, geom
FROM raw_voting_precincts;
running:
$ psql our_arlington < new_tables_from_old.sql
returned:
INSERT 0 2188
INSERT 0 51
so I can now drop the “raw” tables and confirm what remains:
our_arlington=# drop table raw_census_blocks;
DROP TABLE
our_arlington=# drop table raw_voting_precincts;
DROP TABLE
our_arlington=# \dt
              List of relations
 Schema |       Name       | Type  |  Owner
--------+------------------+-------+---------
 public | block_groups     | table | jelkner
 public | census_blocks    | table | jelkner
 public | spatial_ref_sys  | table | jelkner
 public | voting_precincts | table | jelkner
(4 rows)
and take a look with QGIS to confirm I see what I expect to see:
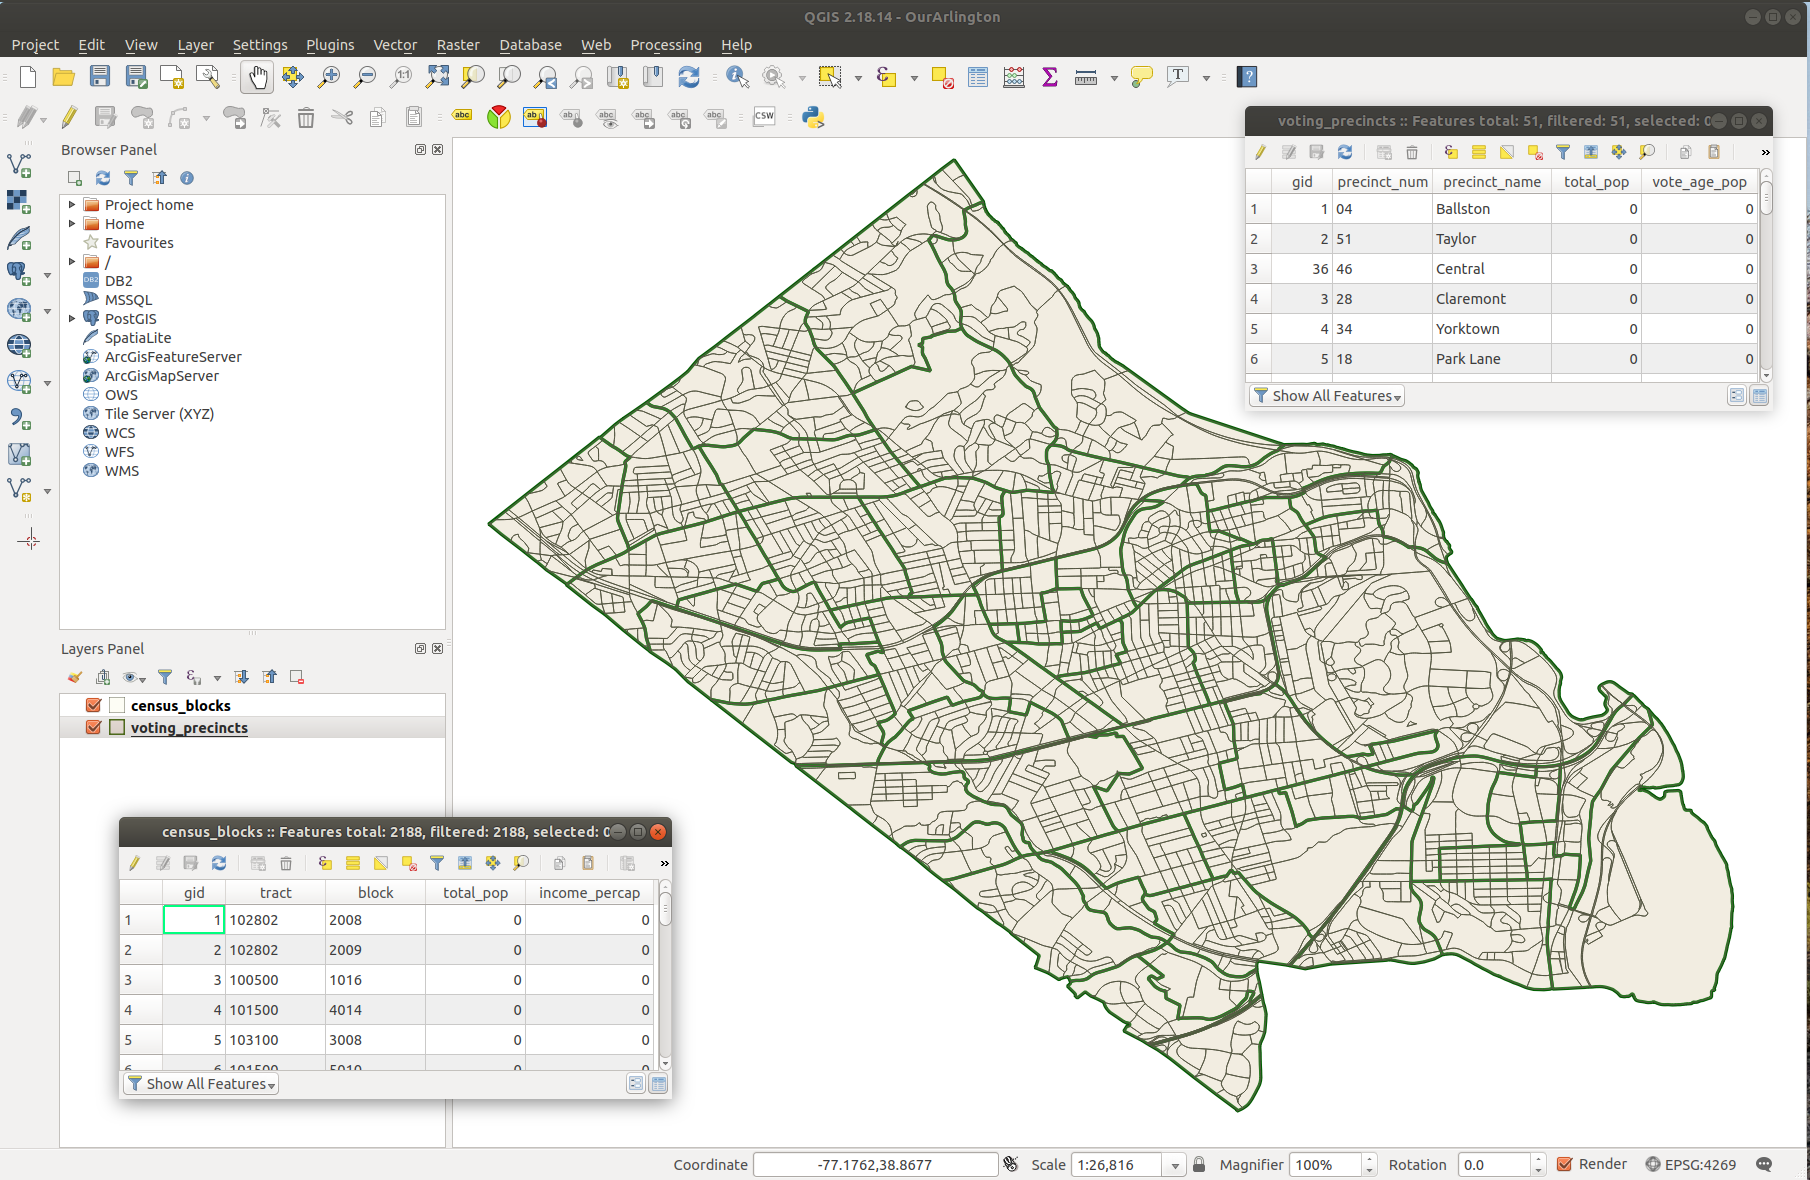
Next I will update the tables with the required data. To put data from the
acs5.jason file into the block_groups table, I wrote a little Python
script:
import json

f = open('block_groups_inserts.sql', 'w')

with open('../Data/acs5.json') as json_data:
    d = json.load(json_data)
    s = 'INSERT INTO block_groups\n'
    s += 'Values ({}, {}, {});\n'
    for row in d[1:]:
        f.write(s.format(row[3], row[4], 0 if not row[0] else row[0]))

f.close()
which generates insert statements in a file named block_group_inserts.sql.
I ran:
$ psql our_arlington < block_groups_inserts.sql
and then connected to the database with psql and ran:
our_arlington=# select * from block_groups;
the first page of the output of which confirms the data is the way I want it:
 tract  | block_group | income_percap
--------+-------------+---------------
 100100 | 1           |         62721
 100100 | 2           |         56324
 100100 | 3           |         69363
 100100 | 4           |         66618
 100200 | 1           |        106549
 100200 | 2           |         78695
 100200 | 3           |         92958
 100200 | 4           |         80060
 100200 | 5           |         72759
 100200 | 6           |         82211
 100300 | 1           |        115597
 100300 | 2           |         96352
 100300 | 3           |         86846
 100300 | 4           |        151874
 100300 | 5           |         51250
 100400 | 1           |         97215
 100400 | 2           |         76711
 100400 | 3           |        112307
 100500 | 1           |         68058
 100500 | 2           |         68436
Next I need to follow a similar process with arl_nov_2010_voter_data.csv.
import csv

f = open('voting_precincts_updates.sql', 'w')

with open('../Data/arl_nov_2010_voter_data.csv') as csvfile:
    csvr = csv.reader(csvfile)
    h = csvr.__next__()
    s = 'UPDATE voting_precincts\n'
    s += 'SET vote_age_pop = {}, voter_turnout = {}\n'
    s += "WHERE precinct_num = '{}';\n"
    # print(h[0], h[1], h[14], h[-1])
    for r in csvr:
        # print('{} {} {} {}'.format(r[0][-2:], r[1], r[14], r[-1]))
        f.write(s.format(r[14], r[-1], r[0][-2:]))

f.close()
generates a file named voting_precincts_updates.sql. Running:
$ psql our_arlington < voting_precincts_updates.sql
and viewing the first page of the voting_precincts table with:
SELECT precinct_num, precinct_name, vote_age_pop, voter_turnout
FROM voting_precincts;
returns:
 precinct_num |   precinct_name    | vote_age_pop | voter_turnout
--------------+--------------------+--------------+---------------
 46           | Central            |         4739 |          1150
 51           | Taylor             |          892 |           332
 34           | Yorktown           |         2469 |          1291
 18           | Park Lane          |         6094 |          1338
 49           | Monroe             |         2156 |           607
 47           | Four Mile Run      |         2387 |           799
 38           | Arlington View     |         4052 |           906
 42           | Shirlington        |         3089 |           915
 27           | Jefferson          |         3593 |          1375
 44           | Dawson             |         2818 |           807
 48           | Courtlands         |         2850 |           860
 33           | Rock Spring        |         2672 |          1556
 41           | Woodbury           |         4573 |           975
 50           | Crystal Plaza      |         4399 |           814
 12           | Fairlington        |         2648 |          1369
 03           | Aurora Hills       |         1961 |           988
 43           | Arlington Mill     |         4839 |           623
 40           | Virginia Square    |         3863 |          1093
 10           | Wilson             |         5457 |          1238
 37           | Nottingham         |         2369 |          1268
so this table is now ready.
The last table to populate is census_blocks, which needs its total_pop
and income_percap fields filled in.
Population data for census blocks in Arlington County is on the Census Bureau’s Developers website at:
The saved file is named sf1.json.
Metadata for this object can be obtained at https://api.census.gov/data/2010/sf1/variables.json. Since this is a very large file it will be helpful to put the relevant part of it here:
"P0010001": {
  "label": "Total Population",
  "concept": "P1. Total Population [1]",
  "group": "N/A",
  "limit": 0,
  "validValues": [
 ]
},
To generate SQL UPDATE statements for this data I wrote:
import json

f = open('census_block_updates.sql', 'w')

with open('../Data/sf1.json') as json_data:
    d = json.load(json_data)
    s = 'UPDATE census_blocks\n'
    s += 'SET total_pop = {}\n'
    s += "WHERE tract = '{}'\n"
    s += "AND block = '{}';\n"
    for row in d[1:]:
        f.write(s.format(int(row[0]), row[-2], row[-1]))

f.close()
which creates a file named census_block_updates.sql.
I ran:
$ psql our_arlington < census_block_updates.sql
and then connected to the database with psql and ran:
our_arlington=# select tract, block, total_pop from census_blocks;
which confirms the updates were successful:
 tract  | block | total_pop
--------+-------+-----------
 101500 | 2008  |        16
 101500 | 3013  |         0
 101500 | 3018  |         0
 101500 | 3021  |         5
 101500 | 4014  |         0
 101500 | 5005  |        25
 101500 | 5010  |        51
 102802 | 2008  |        54
 102802 | 2009  |        41
 103100 | 3008  |        14
 980100 | 1003  |         0
 101601 | 1007  |        88
 101801 | 1014  |       362
 101801 | 1018  |        75
 101900 | 2010  |        33
 101900 | 2011  |        32
 102200 | 1004  |         0
 103000 | 1004  |         0
 103000 | 2002  |         0
 103100 | 1004  |        57