Vote Arlington 1: Setting Up the Postgis Database
The Problem
I want to explore the statistical relationship between voting participation rates and income levels in Arlington County, Virginia. I am beginning with the assumption that I will find a direct correlation between the two - higher income levels will correlate with higher voter participation rates.
Creating the Database
I’m working on an Ubuntu 18.04 server with PostgreSQL 10 and PostGIS 2.4 installed. These tools can be installed on a fresh server with the following command:
$ sudo apt install postgresql-10-postgis-2.4
To allow external connections to the database, I edited
/etc/postgresql/10/main/pg_hba.conf and changed:
host all all 127.0.0.1/32 md5
to:
host all all 0.0.0.0/0 md5
and then edited /etc/postgresql/10/main/postgresql.conf and changed:
#listen_addresses = 'localhost'
to:
listen_addresses = '*'
and then finally ran the following command to restart the database server and have these changes take effect:
$ sudo service postgresql restart
Next I gave my user database superuser privileges and set its postgress password with:
$ sudo su - postgres
$ createuser --superuser [user]
$ psql -c "ALTER ROLE [user] PASSWORD '[password]'"
$ exit
so I could create a database with:
$ createdb our_arlington
$ psql -d our_arlington -c 'CREATE EXTENSION postgis'
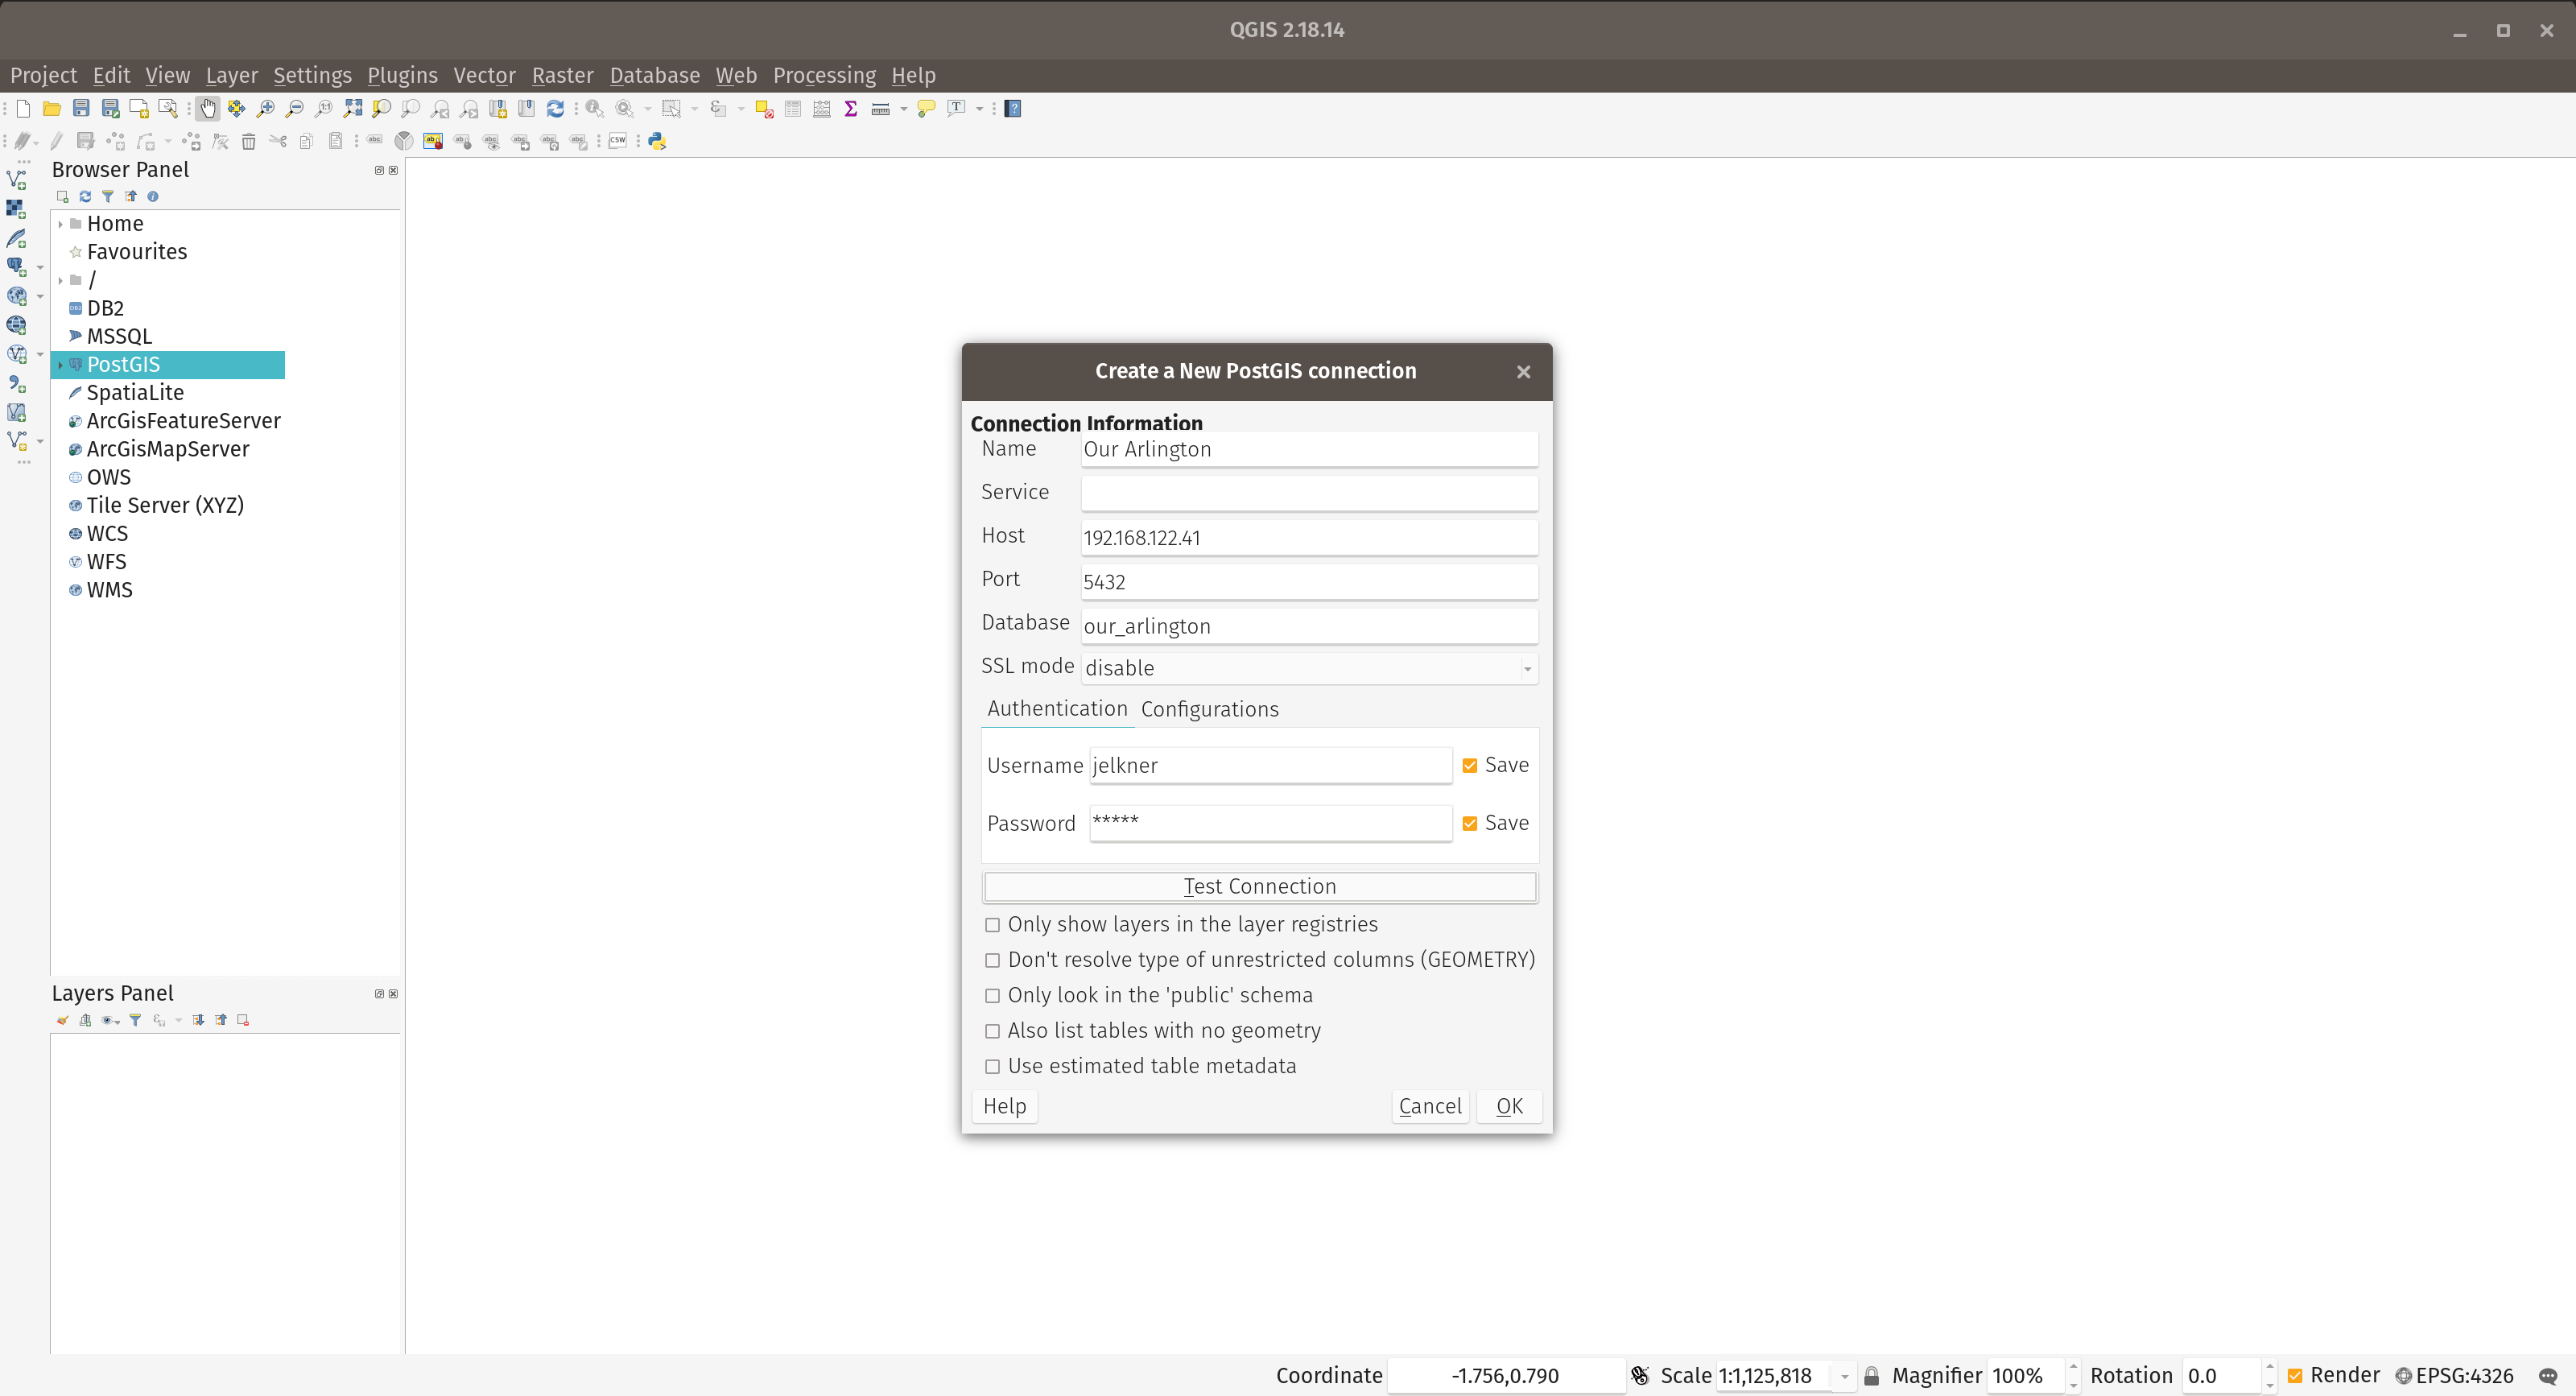
I installed this postgres server on a
KVM using
virt-manager. On
the 192.168.122.x network that virt-manager creates, this server had
address 192.168.122.41. To verify I could connect to it I ran:
$ psql -h 192.168.122.41 -p 5432 -U jelkner -d our_arlington
When greeted with:
our_arlington=#
I knew the database was ready.
With a spatial database created, it’s time to get the data.
Getting the Boundary Data
Since I will be comparing voting participation rates and average income to test for correlation, I will need to get data for each of these values for the same population. Therein lies a challenge. Voting participation rates are only available by voting precinct, while demographic data on average income is not generally reported that way.
This project is proving to be a great way to introduce myself to political geography. The Standard Hierarchy of Census Geographic Entities provides a window into the problem and suggests the first question to explore. Are voting districts comprised of census blocks or do voting district boundaries cut across census blocks? Figure 2-1 from chapter 2 of the Geographic Areas Reference Manual, titled “Geographic Hierarchy for the 1990 Decennial Census” suggests that at least in 1990 the voting districts were built from census blocks.
I’ll begin by loading boundaries of each into the database and see what I find.
For census block boundaries for Arlington County, Virginia, I went to
2010 TIGER/Line® Shapefiles: Blocks and selected Virginia and then Arlington County. This gave
me a directory named tl_2010_51013_tabblock10 that contained the Arlington
census block boundaries from the 2010 census.
To find the spatial referencing system used by the Census Bureau data, I ran the following command inside the directory with the unzipped census block shapefile:
$ ogrinfo -al -so tl_2010_51013_tabblock10.shp
The -al switch means “all layers” and the -so means “summary only”. The
output of this command was:
INFO: Open of `tl_2010_51013_tabblock10.shp'
      using driver `ESRI Shapefile' successful.

Layer name: tl_2010_51013_tabblock10
Metadata:
  DBF_DATE_LAST_UPDATE=2012-03-09
Geometry: Polygon
Feature Count: 2188
Extent: (-77.172169, 38.827290) - (-77.032143, 38.934343)
Layer SRS WKT:
GEOGCS["GCS_North_American_1983",
    DATUM["North_American_Datum_1983",
        SPHEROID["GRS_1980",6378137,298.257222101]],

        PRIMEM["Greenwich",0],
    UNIT["Degree",0.017453292519943295],
    AUTHORITY["EPSG","4269"]]
STATEFP10: String (2.0)
COUNTYFP10: String (3.0)
TRACTCE10: String (6.0)
BLOCKCE10: String (4.0)
GEOID10: String (15.0)
NAME10: String (10.0)
MTFCC10: String (5.0)
UR10: String (1.0)

UACE10: String (5.0)
UATYP10: String (1.0)
FUNCSTAT10: String (1.0)
ALAND10: Integer64 (14.0)
AWATER10: Integer64 (14.0)
INTPTLAT10: String (11.0)
INTPTLON10: String (12.0)
What I am interested in here is the GEOCS[...]. I want to turn that
information into an SRID. For that I used the web application Prj2EPSG. The following screen shot shows the result I was
looking for:
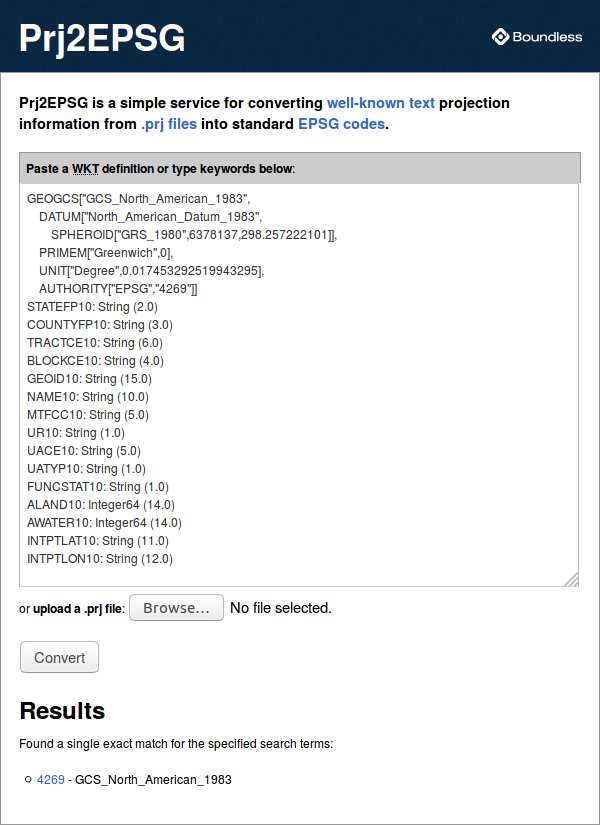
The SRID is 4269 - GCS_North_American_1983. Since this is the first geographic data I’ll be loading into the database, I’ll just use this projection.
Now to convert the shapefile into sql:
$ shp2pgsql -s 4269 tl_2010_51013_tabblock10.shp raw_census_blocks | psql -d our_arlington
I named the table raw_census_blocks because I plan to use SQL to change
it into a census_blocks table later.
After running this command, I connected to the our_arlington
database with:
$ psql our_arlington
and viewed the tables:
our_arlington=# \dt
              List of relations
 Schema |       Name        | Type  |  Owner
--------+-------------------+-------+---------
 public | raw_census_blocks | table | jelkner
 public | spatial_ref_sys   | table | jelkner
(2 rows)
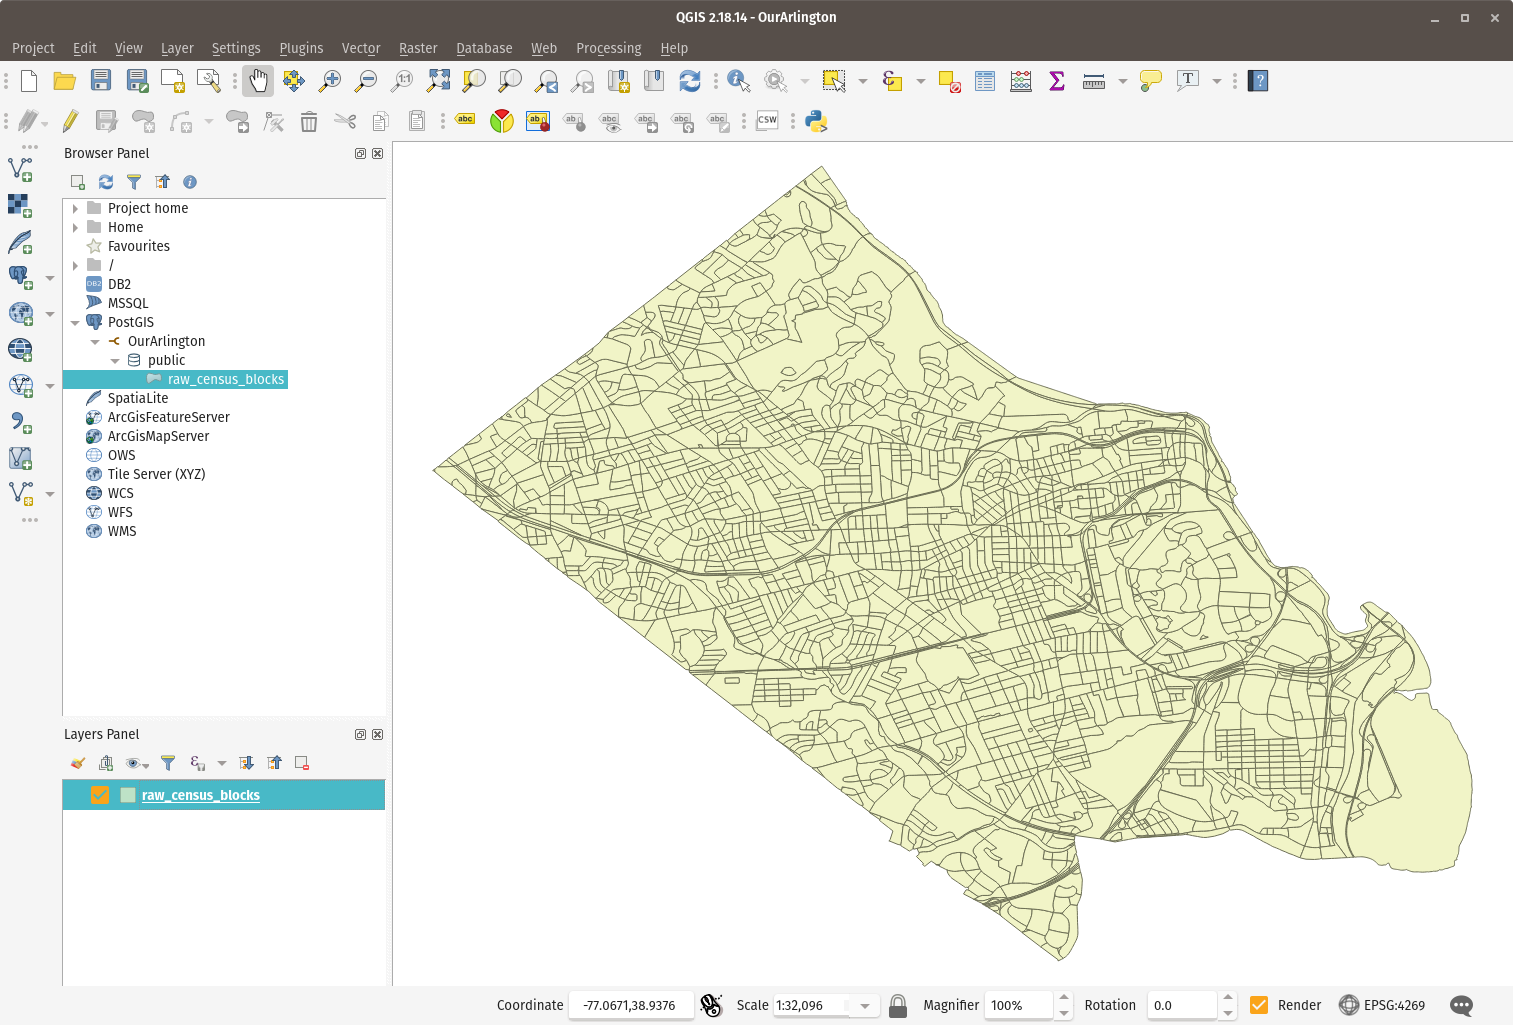
It appears the raw_census_blocks have successfully loaded. I’ll look at them in QGIS to see.
The connection worked. Time to load the census block layer.
Now for the voter precinct layer. Returning to the Census Bureau website at
2010 TIGER/Line® Shapefiles: Voting Districts
and again selecting Virginia and then Arlington County gave me a directory
named tl_2010_51013_vtd10 that contained the Arlington voting district
boundaries from 2010.
Note
I first tried to use the voter precinct data from the
Arlington County, VA - Official GIS Open Data Portal.
This data had SRID 4326 - GCS_WGS_1984 - a different projection than
the census tracks, so I needed to convert it when loading it:
$ shp2pgsql -s 4269:4326 Voter_Precinct.shp voter_precincts | psql -d our_arlington
Since the voting district boundaries didn’t line up perfectly with census block boundaries and since the voting districts were from a different year, I decided to return to the Census Bureau for precinct data.
I ran the following command with the following result from inside the
directory containing tl_2010_51013_vtd10.shp:
$ shp2pgsql -s 4269 tl_2010_51013_vtd10.shp raw_voting_precincts | psql -d our_arlington
and again viewed the tables:
our_arlington=# \dt
                List of relations
 Schema |         Name         | Type  |  Owner
--------+----------------------+-------+---------
 public | raw_census_blocks    | table | jelkner
 public | raw_voting_precincts | table | jelkner
 public | spatial_ref_sys      | table | jelkner
(3 rows)
I loaded the two layers and the boundaries lined up, so it appears that voting precincts are made up of census blocks.